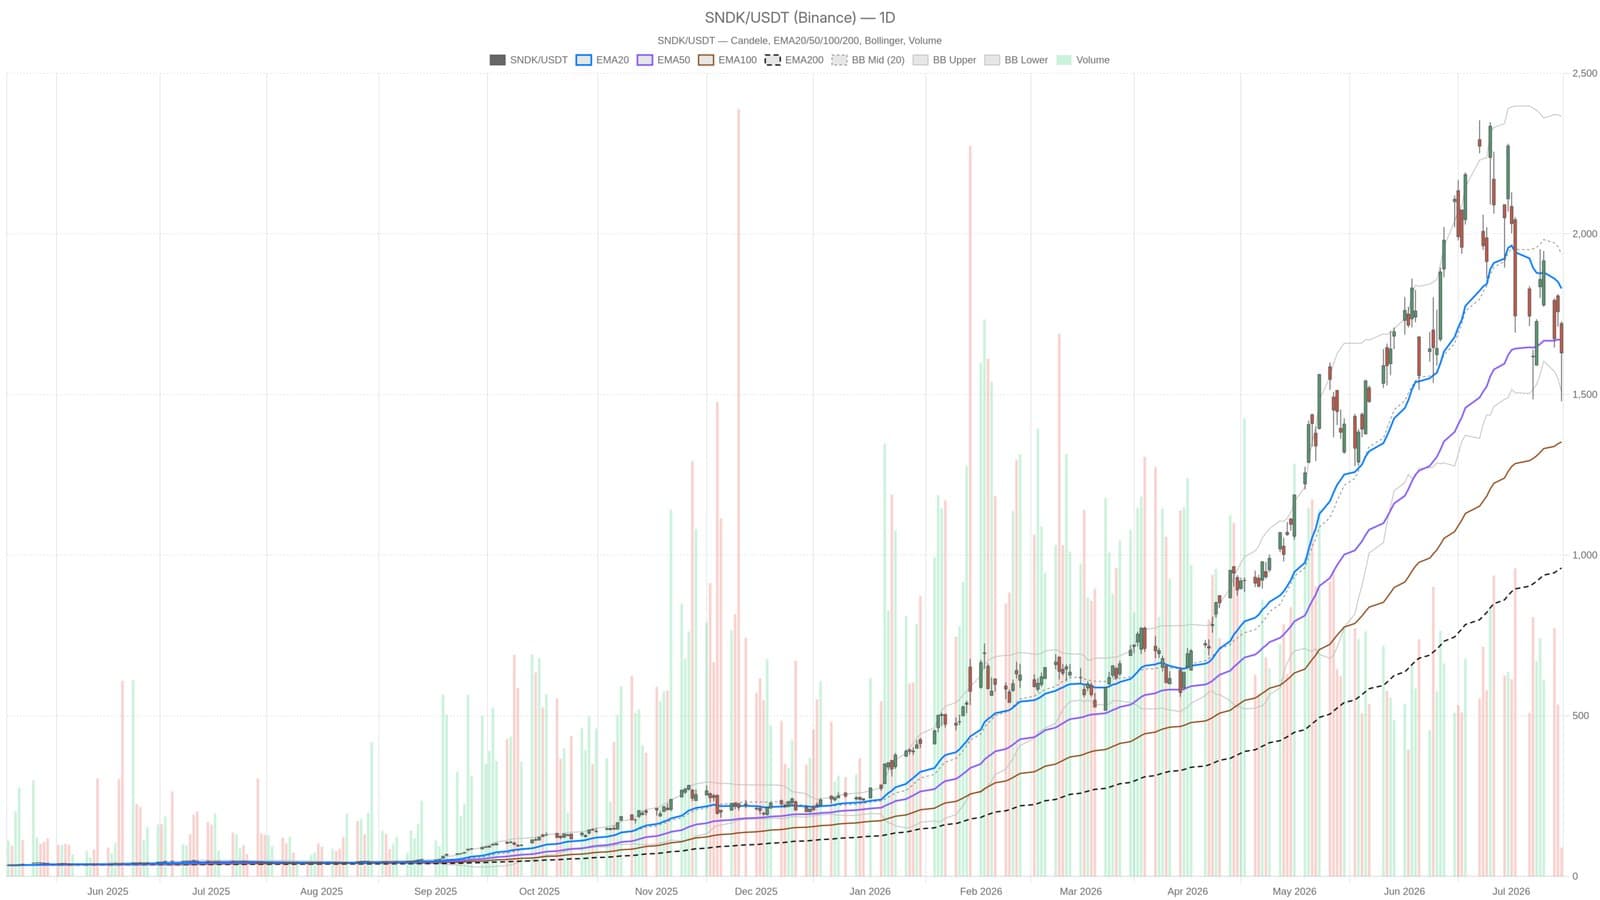
Sandisk Corporation's stock is experiencing a significant slowdown following an extraordinary 4,000% increase. On July 15, shares closed at 1,629.54, marking a steep retreat from the intraday high of 1,728.19. This session highlighted a growing sense of uncertainty among investors, as momentum shifts from a remarkable rally to a bearish outlook.
The technical indicators tell a cautionary tale. The daily MACD histogram now sits at -55.47, reflecting substantial downward momentum. Trading below key exponential moving averages (EMAs) further reinforces the bearish sentiment. The EMA20 is positioned at 1,830.01, while the EMA50 is at 1,669.58, and the EMA200, a longer-term measure, hovers much lower at 959.89. This configuration suggests that the recent upward trend may be rolling over.
Market Sentiment and Volatility
Current trading patterns indicate that sellers are firmly in control. The RSI is nearing oversold territory at 44.8, hinting that further deterioration could occur before a solid support level is established. Additionally, the volatility remains extreme, with an average true range (ATR) of 241.28, signaling that daily fluctuations can exceed 200 points either way.
Investors will be watching closely as Sandisk prepares for its fiscal Q4 2026 earnings report on August 5. This event could serve as a key moment, potentially overriding current technical signals and reshaping the market's perception of the stock. For those keeping track, this period of instability echoes trends seen in other tech stocks, such as Dell Technologies, which has also faced significant declines.
As Sandisk navigates this critical phase, the daily pivot point at 1,612.23 serves as a reference for immediate market direction, with resistance at 1,745.50 and support at 1,496.26. The stock's ability to break through these levels will be closely monitored as investors reassess their positions.
This material is for informational purposes only and should not be considered financial advice.