The PUMP token has caught the attention of traders as its price dynamics continue to unfold. After a recent attempt to break through resistance, there are growing concerns about whether the support levels can hold. Traders are now closely monitoring reversal patterns and a noticeable decline in selling pressure, setting the stage for potential shifts in both spot and derivative markets.
As of the latest updates, PUMP is trading at approximately $0.001466, reflecting a slight decline of 1.23% over the past 24 hours. Interestingly, trading volume has surged by 30.66%, reaching $42.41 million according to data from CoinMarketCap. However, the token has suffered a significant weekly loss of 10.26%, extending its recent downturn.
Understanding the Current PUMP Price Pattern
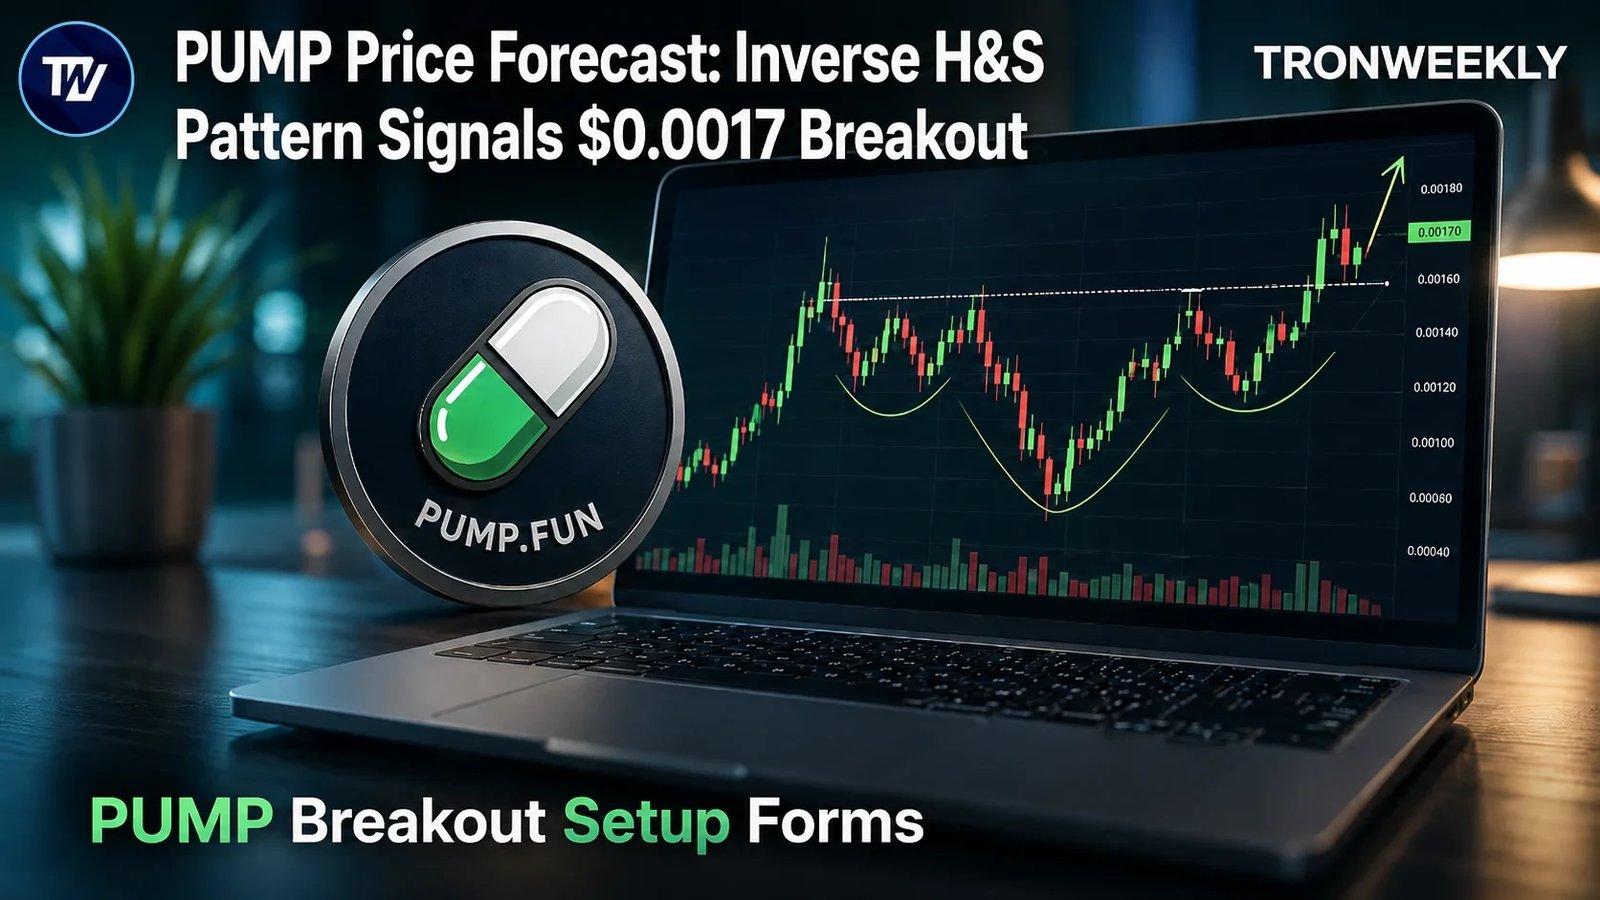
Analyst Crypto Woodyz recently pointed out an intriguing inverse head and shoulders pattern forming on PUMP's four-hour chart. This pattern is generally perceived as a bullish reversal signal. Woodyz suggested that traders might explore long positions around the current price levels, particularly if they can accumulate more around $0.001400 or lower. A key breakout above the resistance level is essential for this bullish setup to gain traction.
If PUMP manages to push past $0.001700, a more substantial rally could be on the horizon. Until then, the price remains constrained below the critical resistance highlighted by analysts, making this zone a focal point for traders.
Market Dynamics and Moving Averages
Additionally, another analyst, Crypto With Gopal, has noted that PUMP is developing a long-term falling wedge pattern, indicative of a prolonged downtrend with diminishing selling pressure. Buyers are currently defending the support range between $0.001400 and $0.001500. A breach of the resistance at the wedge's bottom could trigger a significant recovery. Conversely, a loss of support in this area would delay the anticipated bullish reversal.
According to TradingView data, the 20-day Exponential Moving Average (EMA) is positioned at $0.001500, while the 50-day EMA is slightly higher at $0.001558, indicating that PUMP is trading below both averages. The larger 100-day and 200-day EMAs are even higher, sitting at $0.001710 and $0.002226, respectively, suggesting that PUMP faces considerable upward pressure.
In terms of volatility, Bollinger Bands indicate that the middle line sits at $0.001463, with the upper band at $0.001684 and the lower band at $0.001242, further emphasizing the current price's position in relation to market dynamics.
Increase in Derivative Activity
Despite the ongoing price decline, derivative trading has seen a notable uptick. Data from CoinGlass shows that futures trading volume has risen by 22.88% to $87.98 million, while open interest has slightly decreased by 0.40% to $123.58 million. The funding rate weighted by open interest is currently at -0.0021%, reflecting market sentiment.
At this juncture, PUMP's price is caught between immediate support levels and the crucial $0.001700 resistance area. Traders are vigilantly watching for either a confirmed breakout or a potential slip from the defended support zone.
This material is informational and should not be considered financial advice.