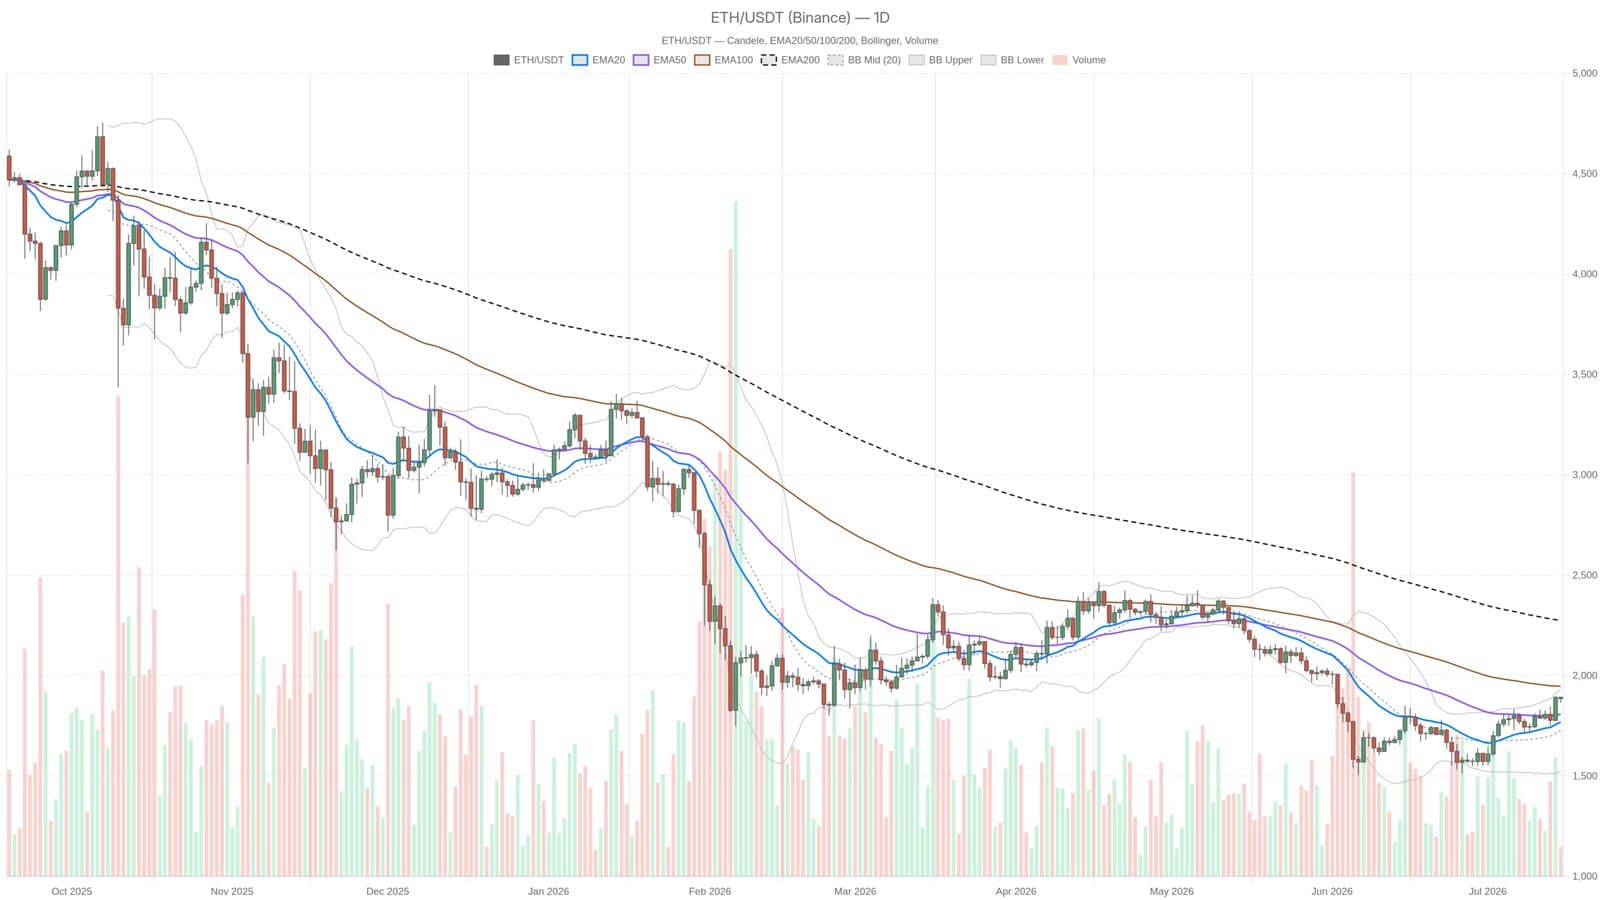
On July 15, 2026, Ethereum is trading at $1,885.58, hovering just above a key level of $1,881.09. This spot reflects a tug-of-war between an improving trend and a market still entrenched in Extreme Fear, with the Fear & Greed Index currently at 25. The outcome of this tension could dictate Ethereum's next major move.
Momentum Indicators Suggest Potential Upswing
Recent analysis shows that Ethereum’s daily MACD histogram sits at 22.71, indicating a solid acceleration in momentum rather than a mere bounce. A significant contributor to this surge is the dramatic rise in Uniswap V3 fees, which have jumped by an impressive 183.86% in the past month, a sign that on-chain activity is ramping up.
Historically, when Ethereum closes above $1,930, it opens the pathway to test the $2,000 mark. Conversely, a break below EMA50 at $1,806.49 could undermine the bullish scenario. Thus, traders are keeping a close eye on these levels.
Market Context and Technical Analysis
The broader crypto market capitalization currently stands at around $2.30 trillion, with Bitcoin accounting for 56.32% of this total. Ethereum has been exhibiting constructive price action, recently closing above both the EMA20 at $1,768.46 and EMA50 at $1,806.49, establishing a bullish configuration that suggests the potential for sustained upward movement.
However, caution is advised. The Bollinger Bands indicate that while Ethereum has surged past the upper band of $1,930.37, the distance to the midline at $1,727.48 is still significant. The average daily range sits at $72.59, suggesting that one strong trading session could test that upper boundary, which often acts as a temporary resistance point.
In the hourly timeframe, while the bullish trend remains intact, there are signs of waning momentum as prices hover at $1,885.87, slightly above the critical EMAs. Traders should be cognizant of these early indicators that may signal a shift in the space.
This article is for informational purposes only and does not constitute financial advice.