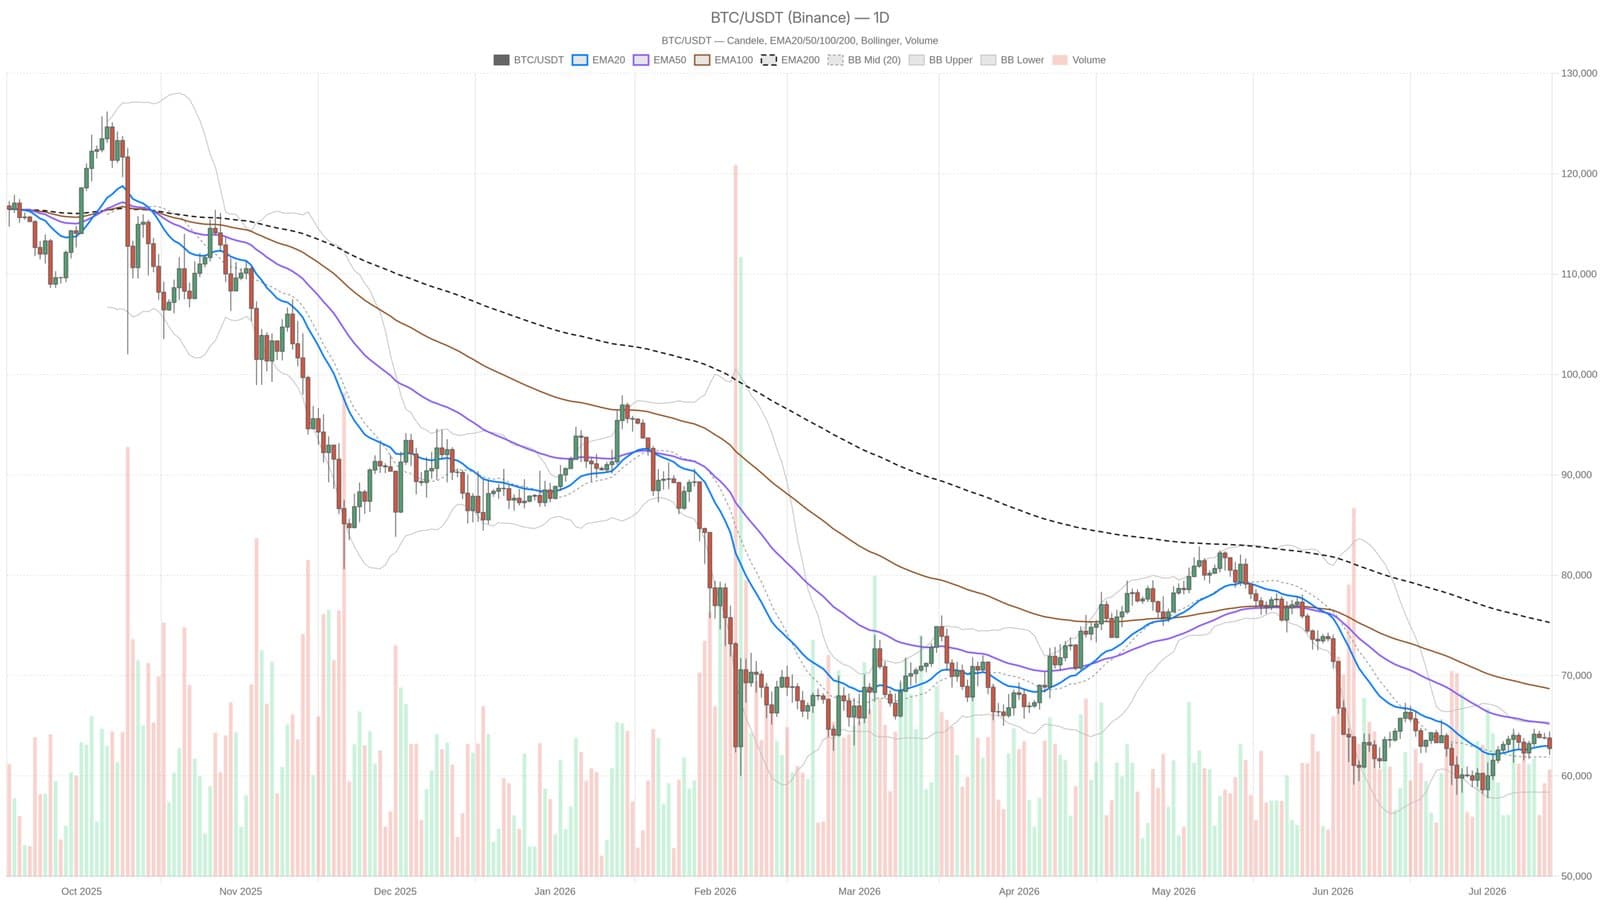
Bitcoin finds itself at a crucial juncture as it struggles to maintain its footing around $62,700 amidst rising inflation concerns driven by oil prices. As of July 13, 2026, BTC trades at approximately $62,734, while the Fear & Greed Index plummets to 28, indicating a pervasive sense of fear among investors in the cryptocurrency market.
Market Overview
The current bearish sentiment is palpable, with Bitcoin's performance stuck below all major moving averages. The daily Relative Strength Index (RSI) sits at 47.37, which positions it just under the neutral line. This suggests a market where sellers are consistently emerging during even minor price recoveries, preventing any significant upward momentum.
Amid these dynamics, institutional movements further complicate the landscape. A notable strategy has recently increased its reserves to $3 billion while also executing its most substantial sale of Bitcoin to date, amounting to $216 million. This action sends mixed signals regarding investor confidence in BTC's stability.
Technical Indicators
Examining the technical indicators reveals a bearish structure, yet not one without hope. The MACD histogram, while firmly in negative territory, has shown signs of positivity, indicating that the rate of bearish pressure may be slowing down. Specifically, while the MACD’s main line is at -238.51, the histogram reads +425.95, suggesting a potential easing in downward momentum.
The daily pivot point is critical, located at $63,086 just above the current trading price. A break above this level could target $65,386, but failing to hold support at $62,101 might lead BTC down to $61,748 and potentially further to $58,397.
Across the Bollinger Bands, the midline rests at $61,892, with the upper band set at $65,386 and the lower at $58,397. Price movements currently hover between the midline and the upper band, which is a mildly positive setup, but any rally toward the $64,000 to $65,386 zone will likely confront substantial resistance.
In this high-volatility climate, where average true range (ATR) stands at $1,937, large-scale fluctuations are commonplace, with $2,000 swings being considered normal.
This content is for informational purposes only and should not be considered financial advice.